
Financial slides for a pitch deck: explain burn, runway and assumptions
A financial pitch slide should make its assumptions inspectable: starting cash, period, inflows, outflows and the milestone the funding supports. Keep actual results separate from projections. A clean chart cannot resolve an undefined burn rate or make an uncertain collection date into cash available today.

Worked example
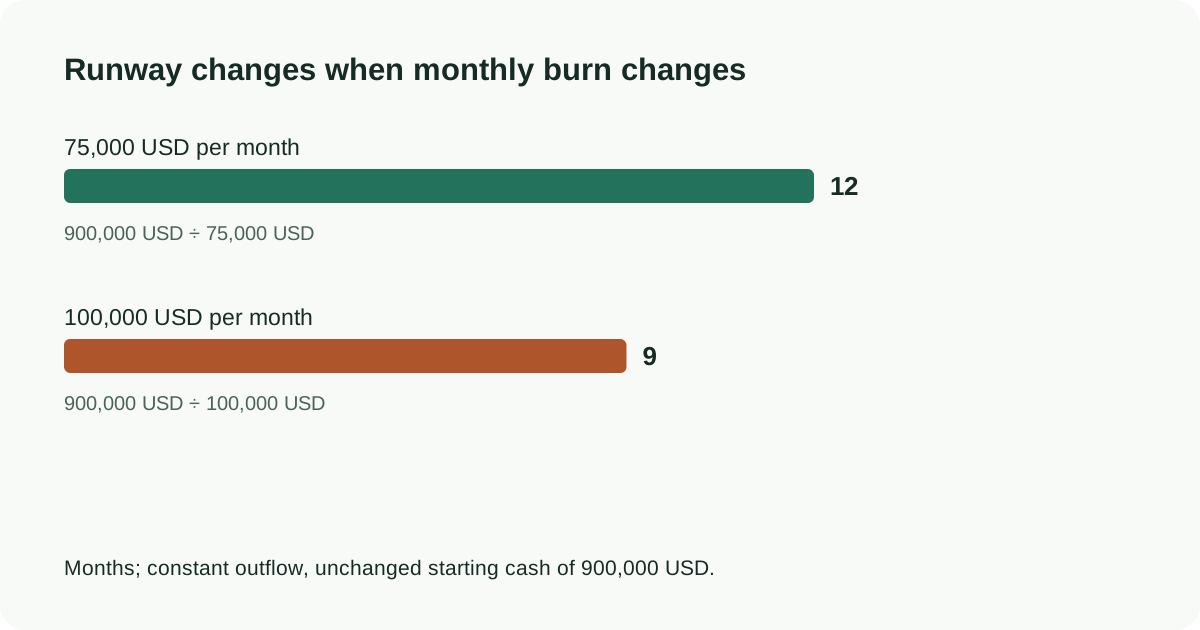
With 900,000 USD in cash and net cash outflow of 75,000 a month, a constant-burn runway calculation gives twelve months. If planned hiring adds 25,000 a month immediately, the same simplified calculation gives nine months. Put the cash date, burn definition and hiring assumption on the slide. Annual contract value is not cash received, and an invoiced sale may not pay this month. Link the pitch calculation to the actual cash forecast before presenting it as a financing plan.
- State the currency, period and definition of each metric.
- Calculate net burn from cash outflows minus inflows; show the assumptions behind runway.
- Link the funding request to a milestone and show a downside scenario.
From calculation to a defensible headline
Write the formula beside the source values before choosing a chart. A total, a rate and a change in a rate need different denominators. Round only the displayed answer so repeated rounding does not distort the comparison.
- Record period, unit and population for each input; distinguish actual results from a plan or forecast.
- Recalculate the headline independently from the chart, then check that both tell the same story.
- Turn the result into a specific decision. Keep proposed explanations as questions until separate evidence supports them.
Prepare a base case and one clearly defined sensitivity, such as a delayed receipt or earlier hire. Change that input in the supporting cash schedule rather than changing only the headline runway. Show the cash date and whether burn includes one-off costs. If the business is pre-revenue, explain the milestone and evidence needed next; do not fill an empty traction chart with unsupported sales. This is a presentation framework for explaining a forecast, not investment advice or a substitute for a finance-reviewed model.
Put the workflow into practice
Start with your approved source in Pageworks. Review the outline, generate the deck and refine the result. Pro supports up to 50 slides and editable PowerPoint export; choose the plan that matches your handoff.
Sources and further reading
Build your next presentation with Pageworks
Editable PowerPoint with Pro — or start on Free today
Related articles

Oct 11, 2026 · 2 min read
Excel to presentation: turn a spreadsheet into a clear argument
Oct 8, 2026 · 2 min read
Consulting Presentation Structure: An Answer-First Example
Oct 1, 2026 · 2 min read
Markdown to PowerPoint: Choose a Conversion Workflow